Balance Sheet Leverage Strategies Using Agency MBS: Q1 2020
Overview
Agency mortgage-backed pass-through securities funded with fixed rate advances from the Federal Home Loan Bank of Chicago (FHLBank Chicago) can produce attractive investment income, with little change to risk-based capital ratios. In this paper, we discuss strategies for funding a $24 million portfolio of mortgage-backed securities (MBS) with a ladder of FHLBank Chicago fixed rate advances.
Agency MBS Investment Portfolio
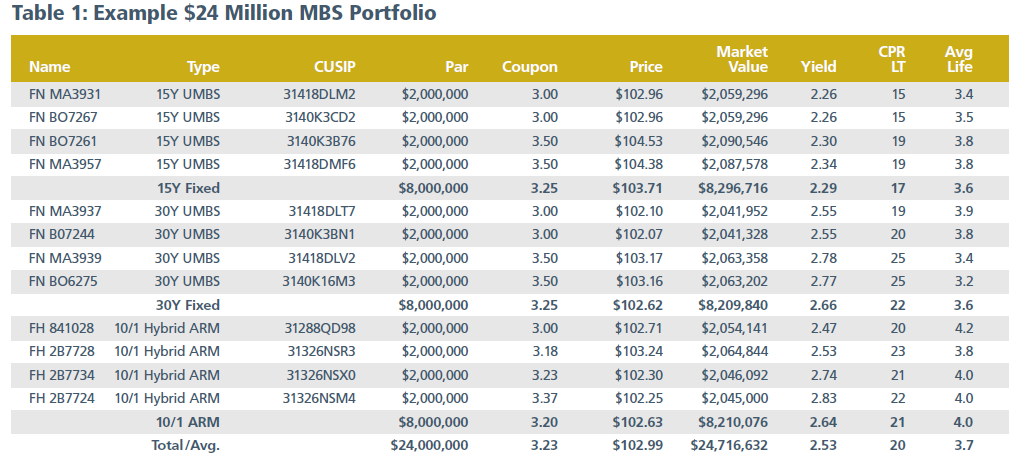
The $24M universal mortgage back security (UMBS) and adjusted rate mortgage (ARM) portfolio described in Table 1 contains equal thirds of 15-year fixed, 30-year fixed, and 30-year hybrid ARM mortgage pass-through bonds. The portfolio pricing is as of January 28, 2020. The underlying loans have a weighted average loan age less than or equal to 1 month as of the pricing date. The weighted average original loan size is greater than $290,000 and less than $464,000. The weighted average long-term constant prepayment rate (LT CPR) is estimated at 20.
Funding the MBS Portfolio, Option 1
The advances suggested to fund this strategy include a ladder of fixed funding, and approximately 25% of the funding comes from deposits. The deposits are assumed to have an average rate of 1.08%, based on 1% cost of funds adjusted by forward 1-month LIBOR, beta of 0.6, and a lag of 10 basis points per month in each rate shock scenario. Advance and deposit data are as of January 28, 2020. The funding strategy shown in Table 2 totals $25 million to fully cover the premium market value of the MBS portfolio.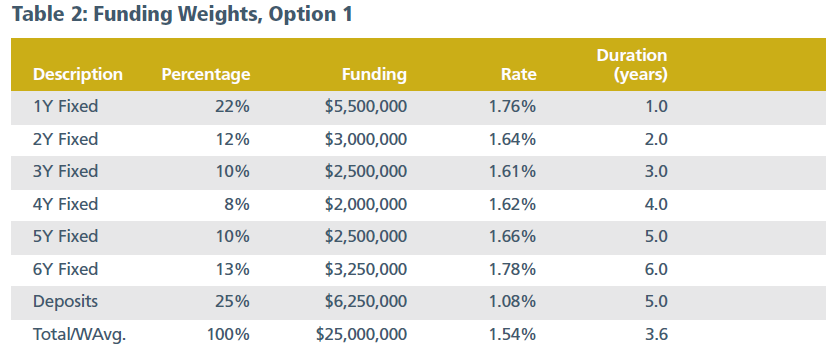
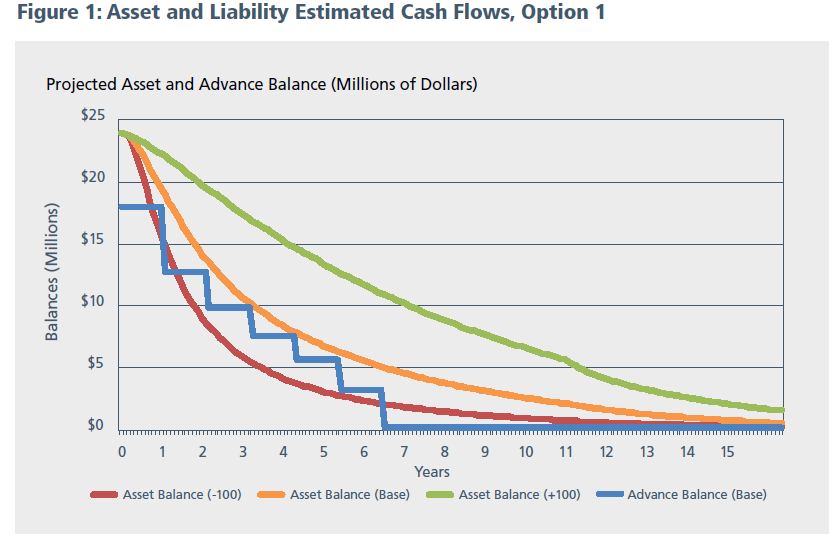
Figure 1 displays the asset and advance balances in various instant rate shock scenarios over a 15-year horizon. Loans underlying MBS assets can be prepaid, which creates variability in the timing of cash flows. The asset balance decreases sharply in the falling-rate scenario due to faster prepayments (which is known as contraction risk) and decreases much more slowly in the rising-rate scenario due to slower prepayments (which is known as extension risk). The strategy is designed with a ladder of fixed rate advances of different maturities, scheduled to reduce the funding in line with the estimated asset balance in the base case scenario. Deposits or other sources of funding are assumed to fill the gaps when needed. New MBS securities are assumed to replace the paid-down balance up to the excess advance balance. This only occurs in scenarios
when the advance balance surpasses the estimated asset balance, such as when rates are down 100 basis points.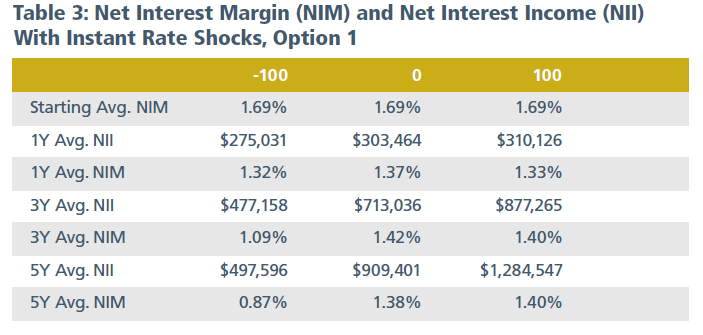
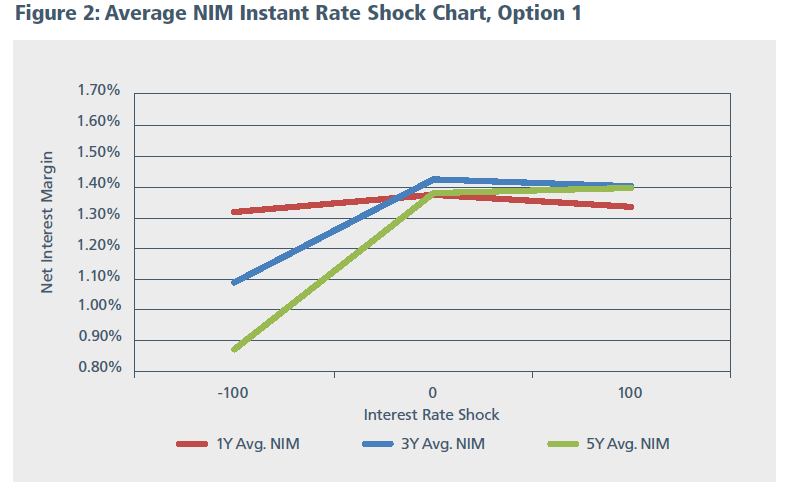
The income a financial institution could make by following the strategy can be seen in Table 3 and Figure 2. NIM is expressed as the income earned from assets, less the expense generated by the funding, divided by the average asset balance. The starting NIM of the strategy is 1.69%, and the 5-year average NIM ranges from 87 basis points to 140 basis points in instant rate shock scenarios of -100 basis points to +100 basis points, respectively. The model assumes the reinvested assets will earn a spread of 100 basis points over the funding.
As seen above, the leverage strategy suffers NIM compression when interest rates fall. The contraction risk of the mortgages is realized as prepayments increase in the falling-rate scenario, while the ladder of fixed advances remains unchanged in a higher-rate scenario. Additionally, the extension risk of slower prepayments is realized as rates rise. In that scenario, higher-rate deposits cover more of the funding as the lower-rate advance funding matures. The additional deposit funding needed to fill the gaps is assumed to have a beta of 0.6 and a lag of 10 basis points per month for each rate shock scenario.
Funding the MBS Portfolio: Option 2
Institutions willing to take on more risk may want to consider adding putable advance funding to the mix. A putable advance gives FHLBank Chicago the right to terminate after a lockout period. In return for this option, the member typically receives a considerably discounted rate. For example, a 10-year fixed rate advance was 2.04% as of January 28, 2020. That same advance, with options controlled by FHLBank Chicago to terminate, or “put,” the advance starting 1 year after execution and every 3 months going forward thereafter, has a rate of 0.94%. FHLBank Chicago has named this type of advance the Fixed Rate Bermudan Putable. See Table 4 for a ladder of funding that includes putable advances, displayed with the maturity in years followed by the lockout period in years or months (for example, 7NP1Y is a 7-year fixed advance that may not be put for 1 year).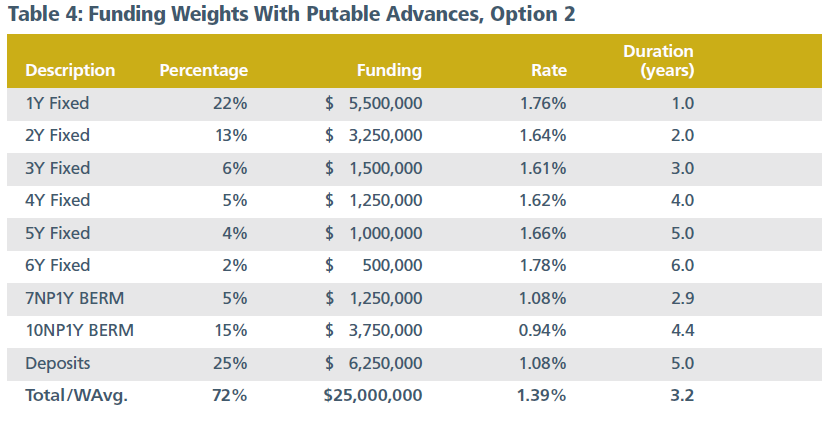
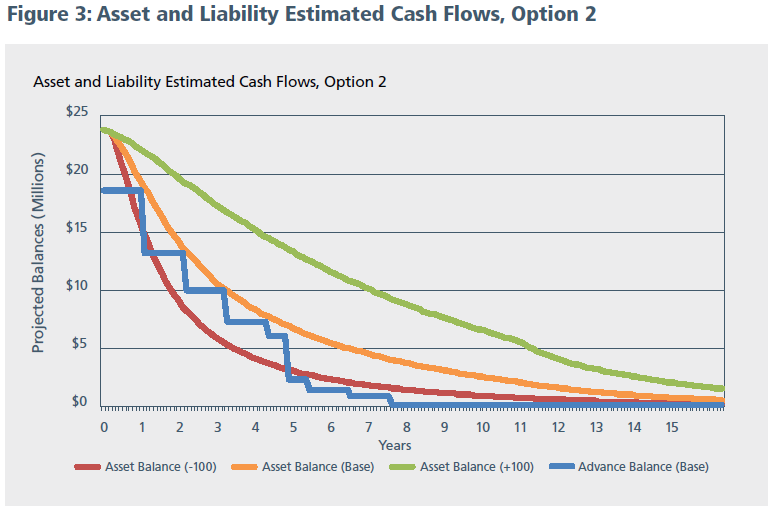
Figure 3 projects asset and liability cash flows using the same MBS asset balance and assumptions described in Option 1. The advance balance covers most of the funding through year 5. As in Option 1, deposits or other sources of funding are expected to fill the gaps. Members willing to accept this risk are expected to earn a higher NIM relative to Option 1 in most interest-rate scenarios.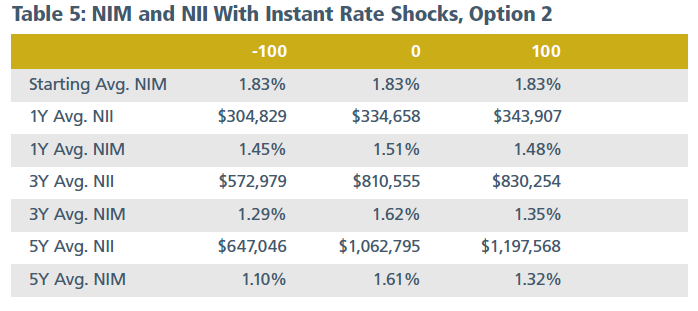
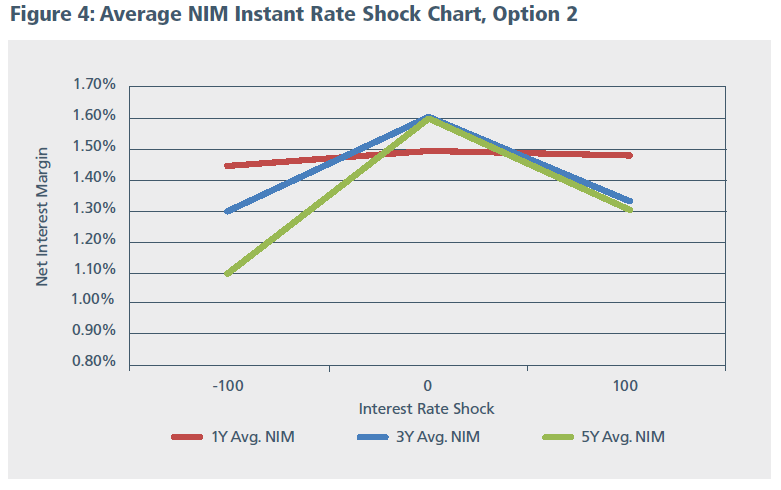
The income a financial institution could make using Option 2 is illustrated in Table 5 and Figure 4. The starting NIM of this strategy is 1.83%, and the 5-year average NIM ranges from 110 basis points to 161 basis points in instant rate shock scenarios of -100 basis points to +100 basis points, respectively. Relative to Option 1, this funding strategy increases the risk of a reduced NIM in a rising-rate scenario, as the putable advance funding is put and replaced with higher-rate deposit funding. This analysis uses the same model and assumptions used in Option 1.
Leverage's Effect in Capital and Other Ratios: Option 1 vs. 2
Leverage may change capital, asset, equity, and other ratios, such as return on average equity (ROAE), return on average assets (ROAA), and return on risk-based capital. FHLBank Chicago members have an average of $488 million in total assets, as of Q3 2019 (excluding non-depository institutions and the top five largest banks by asset size). The $24 million portfolio strategy proposed in this paper represents only 5% of those average assets. Yet, it can make an impact on the bottom line.
Table 6: Ratios for Option 1, Q3 2019
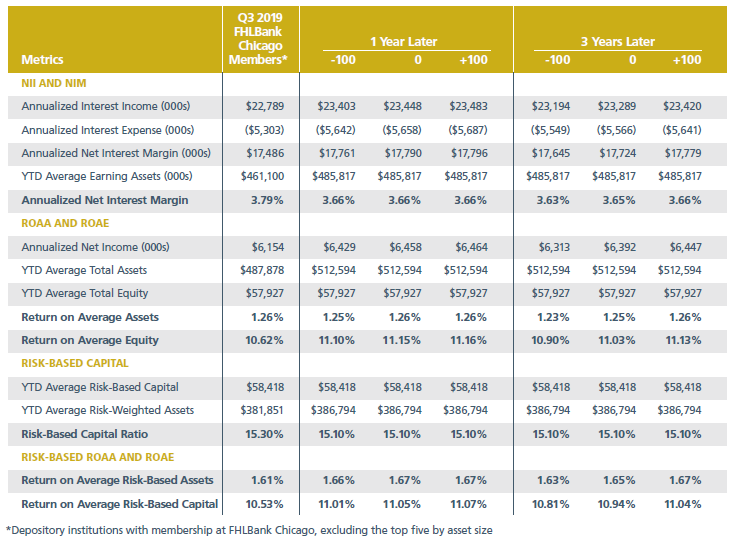
Table 6 shows the effect of Option 1 on ratios created from the averages of sample FHLBank Chicago members over time. The sample members had an ROAA ratio of 1.26% and an ROAE of 10.62% in Q3 2019. Option 1 would add an estimated
53 basis points of ROAE after 1 year, assuming all else remains constant. The figures remain mostly unchanged over a 3-year horizon.
This strategy would decrease an institution’s capital ratios. However, agency MBS securities have a favorable risk-weighting of 20%. Relative to other assets such as loans, MBS securities are seen as less risky due to the backing of a government sponsored enterprise (GSE). Therefore, adding these securities would decrease a member’s risk-based capital ratio by an estimated 20 basis points after execution. Return on risk-based assets and return on risk-based capital would be estimated to
improve by 6 basis points and 52 basis points, respectively, over a 1-year horizon, assuming all else remains constant.
Members earned an average NIM of 3.79% in Q3 2019, primarily driven by loans, which make up a majority of their balance sheet. The lower NIM generated by this strategy would reduce the member’s total NIM by approximately 12 basis points after 1 year. However, more dollars would still be generated after execution. Members could earn over $235,000 per year for 3 years, assuming rates remain unchanged.
Table 7: Ratios for Option 2, Q3 2019
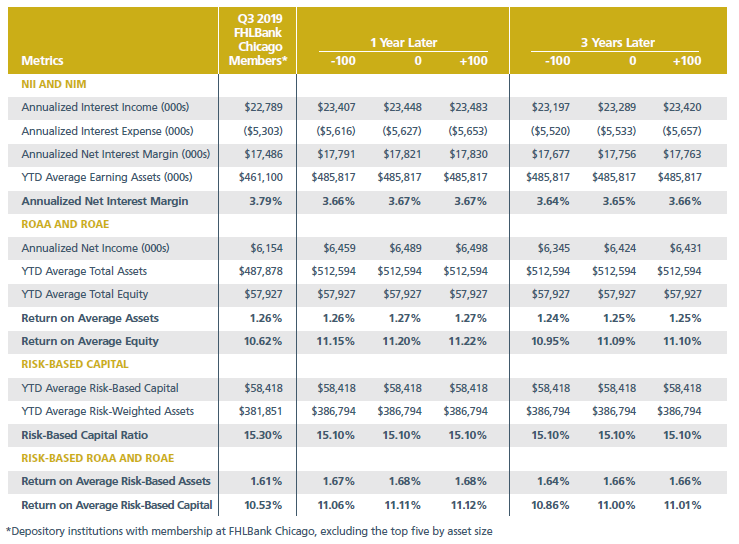
Table 7 shows the effect of Option 2 on ratios created from the averages of the same sample FHLBank Chicago members. Members could expect to increase their ROAA and ROAE by 1 basis point and 58 basis points, respectively, over 1 year if rates remain unchanged.
With Option 2, the decrease in risk-based capital would be equivalent to that seen in Option 1. Return on risk-based assets and return on risk-based capital would be estimated to improve by 7 basis points and 58 basis points, respectively, over a 1-year horizon (assuming all else remains constant). Members could earn over $270,000 per year over 3 years, assuming rates remain unchanged.
While MBS securities are used in this leverage strategy, a variety of other investments could be used. Options include structured collateralized mortgage obligations (CMOs), commercial MBS, or municipal, corporate, or other bonds. Members can also use many different advance structures, with or without embedded options, to meet their needs.
To Learn More
If your institution would like more specific information about these strategies, please feel free to reach out to the Solutions team or your Sales Director at membership@fhlbc.com.Contributors

Nick Simoncelli
Senior Analyst, Sales, Strategy, and Solutions

Ashish Tripathy
Managing Director, Sales, Strategy, and Solutions
Disclaimer
The risks of using leverage strategies should be reviewed by each financial institution to ensure they do not breach any regulatory requirements and understand the characteristics of any investments and borrowings they are making before engaging in such a strategy. The scenarios in this paper were prepared without any consideration of your institution’s balance sheet composition, hedging strategies, or financial assumptions and plans, any of which may affect the relevance of these scenarios to your own analysis. The Federal Home Loan Bank of Chicago makes no representations or warranties about the accuracy or suitability of any information in this paper. This paper is not intended to constitute legal, accounting, investment, or financial advice or the rendering of legal, accounting, consulting, or other professional services of any kind. You should consult with your accountants, counsel, financial representatives, consultants, and/or other advisors regarding the extent these scenarios may be useful to you and with respect to any legal, tax, business, and/or financial matters or questions.
Federal Home Loan Bank of Chicago February 2020
