Banking on Change: Exploring Betas and Marginal Cost of Funds in Illinois and Wisconsin
September 26, 2023
Overview
In our current economic cycle marked by sharply increasing interest rates, depository institutions face a complex interplay of factors that can significantly impact their profitability. Notably, the combination of high deposit betas and negative loan betas poses a challenge to net interest margin (NIM). Institutions must consider not only deposit and loan betas but also evaluate their marginal cost of funds in light of these current market conditions.
In this white paper, we delve deeper into the current high-interest rate cycle and its implications for banks and credit unions in Illinois and Wisconsin. Through our analysis, we shed light on how depository institutions can navigate these challenges to ensure they remain resilient and profitable in the face of evolving market dynamics.
Reading the Signs: A Close Look at the Current Rate Cycle
The United States remains in one of the most aggressive rate-hiking cycles observed in recent history. Since March 2022, the Federal Open Market Committee (FOMC) has raised interest rates by a staggering 525 basis points (bps) in an effort to combat persistent inflation. With this in mind, Federal Reserve (Fed) officials are currently grappling with the question of whether additional rate hikes are on the horizon, or if inflation has subsided enough and the U.S. economy tightened enough to the point of ending their rate hiking campaign.
The following table and graph illustrate how the 2022-2023 rate hike-cycle has far outpaced the increases observed in prior rate hiking cycles. Both the steepness and speed of the current rate-hiking cycle has led to unique challenges for banks and credit unions.
| Period of Rate Hikes | Cumulative Increase in Fed Fund Rate (bps) |
|---|---|
| Mar '88 - May '89 | 381 |
| Jan '94 - Jun '95 | 332 |
| Jan '99 - Jan '01 | 167 |
| Jun '04 - Jul '06 | 429 |
| Dec '15 - Apr '19 | 237 |
| Mar '22 - Aug '23 | 525 |
.png?sfvrsn=1168f59d_1)
Source: Federal Reserve Economic Data: Federal Funds Effective Rate, Percent, Monthly, Not Seasonally Adjusted; Federal Funds Effective Rate, Change, Percent, Monthly, Not Seasonally Adjusted
Note: Beginning and ending periods were identified by periods of three or more rate increases, or three or more rate holds and declines.
The June 14 FOMC dot plot, a gauge of policymakers' expectations, hints at a potential 100 bps decline in the terminal rate by 2024 but such forecasts remain speculative at best.
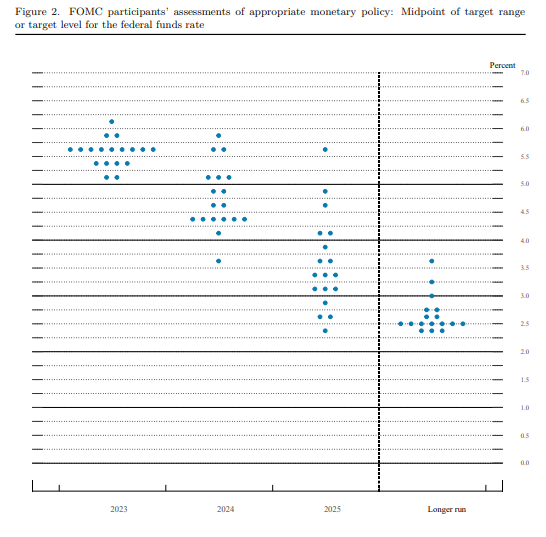
Source: https://www.federalreserve.gov/monetarypolicy/files/fomcprojtabl20230614.pdf
The current rate cycle is atypical from our recent past as rate hikes began amid near zero interest rates. The sudden and drastic increase in rates has impacted consumers to shift the way they think about their money and seemingly has resulted in shifting their deposits to higher yielding alternatives.
Leaders will have to decide whether to increase rates in an effort to keep their deposit base or seek alternative means of funding to bridge their deposit gap as to not dry up consumer lending. These decisions come upon the heels of rate uncertainty as recent economic releases have suggested the potential of a soft landing, which may or may not play out as the Fed seeks to moderate inflation to a target level of 2%.
As we navigate this dynamic rate environment, understanding the impact of this aggressive rate cycle is crucial, starting with its implications on betas.
Deposit and Loan Betas: A Delicate Art in Finance
Understanding the dynamics of deposit and loan betas has become nothing short of imperative. Deposit betas tell us the responsiveness of interest rates paid on deposits relative to changes in market interest rates. Similarly, loan betas capture the relationship between rates charged on new or repriced loans relative to market rates. Both metrics lie at the heart managing a successful asset and liability management (ALM) strategy.
It comes as no surprise that deposit betas across our regional footprint have been on the rise. For this analysis, we have used the second quarter year-over-year change in the Fed Funds Effective rate between 2022 and 2023 as compared to the change in the cost of interest bearing deposits across the same period. With this high level approach, we see that across our District deposit betas are on average 28.8%, keeping in mind that this varies drastically across region and bank.
In Wisconsin, average deposit betas are trending higher overall averaging 31% as compared to Illinois, which averages 28%. However, it is important to keep in mind how the distribution of deposit betas across the district stack up - as they vary significantly across our member banks.
The Pareto graphs below show the distribution of deposit betas across our members in both Wisconsin and Illinois. The bar graphs illustrate the distribution of members falling within the labeled beta ranges, while the line graph represents the percentage of that distribution to the cumulative bank members within each state. This provides a compelling visualization of the different distributions of deposit betas across each region within our district.
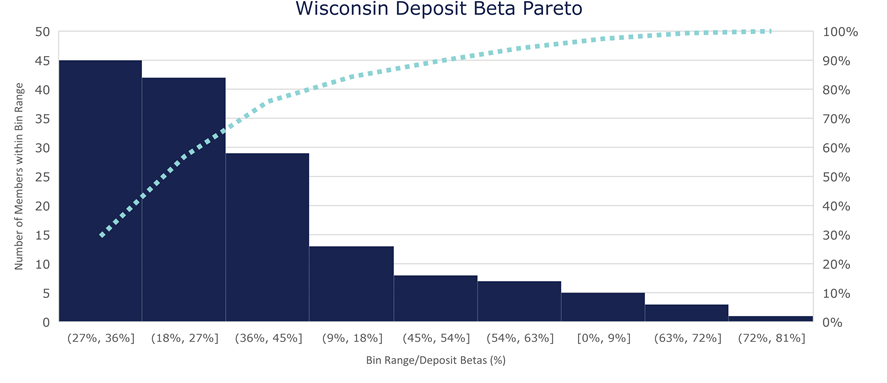
Source: Federal Reserve Economic Data: Federal Funds Effective Rate, Percent, S&P Global: Cost of Interest Bearing Deposits
Across our Wisconsin member banks, we can see that roughly 75% of members are observing deposit betas falling within the 18-45% range, and the 18-36% range being most predominant and accounting for just over 30% of Wisconsin members.
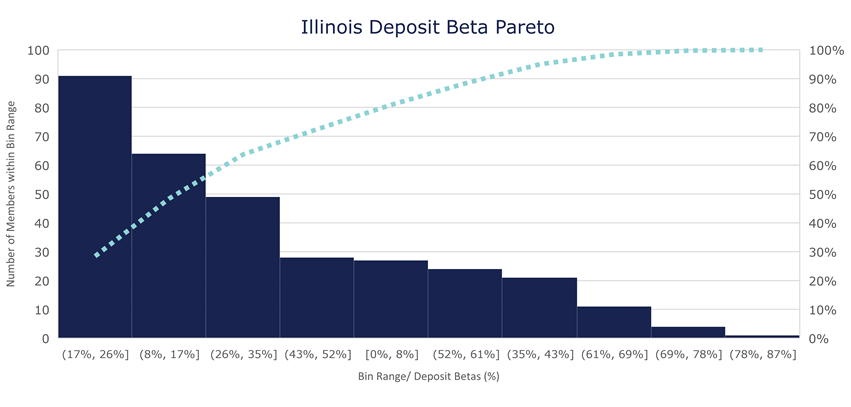
Source: Federal Reserve Economic Data: Federal Funds Effective Rate, Percent, S&P Global: Cost of Interest Bearing Deposits
Comparatively, we can see in the graph above that deposit betas across our Illinois members are a little more staggered. Still, over 60% of our Illinois members fall within the 17-35% deposit beta range, but a larger percent of the distribution fall in the 17-26% range accounting for roughly 30% of our Illinois members.
While rising deposit betas is a significant development, the complexity of our current rate landscape extends when we consider the status of loan betas across our bank members. To conduct our analysis, the second quarter year-over-year change in the Fed Funds Effective rate between 2022 and 2023 as compared to the change in the yield on total loans and leases across the same period of time. Using this analysis, we found loan betas are not keeping pace with the trajectory of deposit betas. On average, loan betas across our bank members are in the 19% range; again with distributions varying drastically with our minimum and maximum ranging from -23% to 123%.
Using the same Pareto graphs for illustrative purposes, we can get a sense of the distribution of loan betas across our bank members. As you can see in the graph that follows, across our Wisconsin bank members, the loan beta distribution for just over 60% of our members range from 10% to 26%, as compared to deposit betas falling within the 18% to 36% range, respectively.
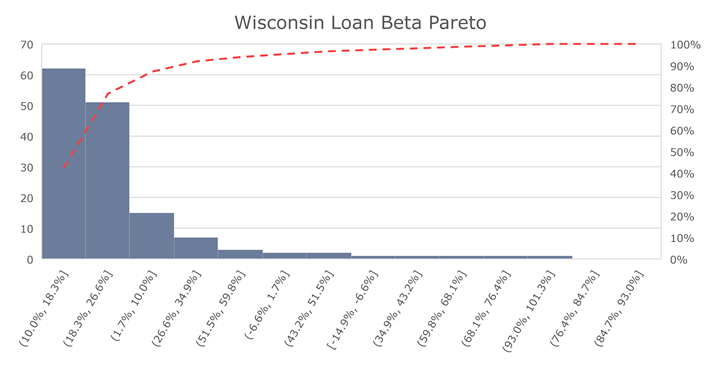
Source: Federal Reserve Economic Data: Federal Funds Effective Rate, Percent, S&P Global: Yield on Total Loans and Leases for FHLBank Chicago member banks
Similarly, across our Illinois bank members we can see that for roughly 80% of our members, loan betas reside in the 5% to 33% range; while deposit betas range from 8% to 52%.
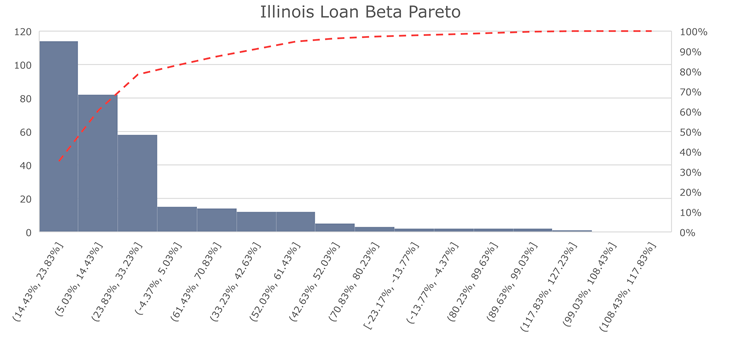
Source: Federal Reserve Economic Data:
Federal Funds Effective Rate, Percent, S&P Global: Yield on Total Loans and
Leases for FHLBank Chicago member banks
Further illustrating the divergence between deposit and loan betas across our bank members, we've constructed a revealing scatter plot. In the graphs below, each state’s banks have been categorized by asset size, as indicated by the legend. Asset class size was determined by the Federal Deposit Insurance Corporation (FDIC), PR-89-2022 indicating that banks with assets falling under $376 million would be considered small; mid-size banks are classified as those with assets greater $376 million but under $1.503 billion; and large banks were classified by those having assets greater than $1.503 billion. Deposit betas charted along the horizontal axis while loan betas mapped on the vertical axis. This scatter plot offers a clear snapshot of the complex interplay at hand.
As deposit betas trend upwards, evident as a cluster along the middle and far end of the horizontal scale, they exert upward pressure on funding costs. Simultaneously, yields on loans and leases are not keeping pace as indicated by data points clustering in the lower part of the vertical axis. These visualizations underscore the challenge of maintaining net interest income. The result is a landscape banks and credit unions will have to grapple with a dual squeeze on profitability, requiring a nuanced approach to navigate the evolving dynamics of interest rate sensitivity.
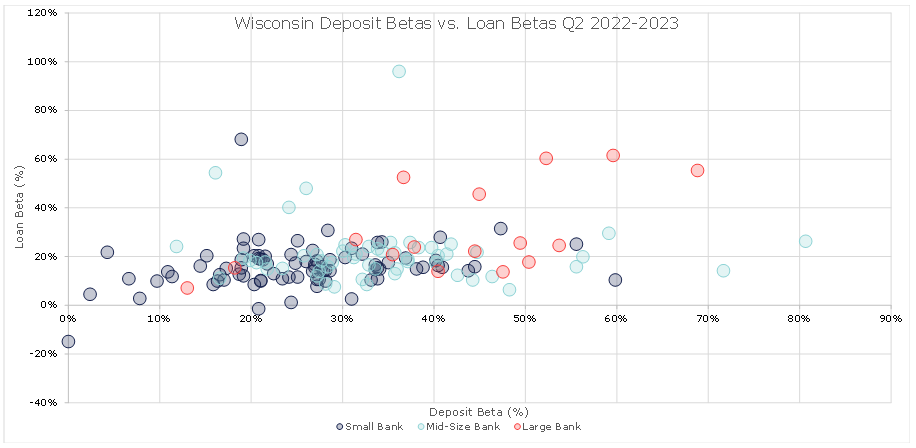
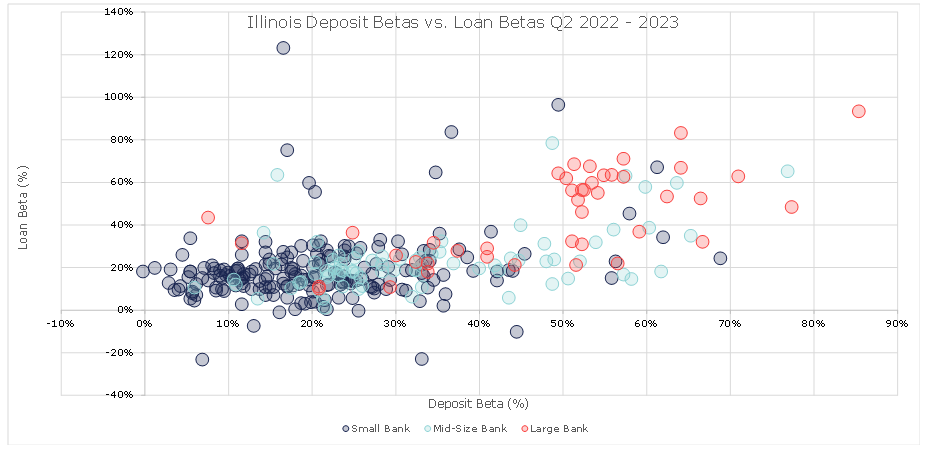
Source: Federal Reserve Economic Data: Federal Funds Effective Rate, Percent, S&P Global: Cost of Interest Bearing Deposits, and Yield on Loans and Leases for FHLBank Chicago member banks. Bank size determined by total assets: FDIC PR-89-2022 https://www.fdic.gov/news/press-releases/2022/pr22089.html
Deconstructing NIM: How Rate Dynamics Impact Profitability
NIM is the quintessential measure of a bank’s profitability and embodies the art of balancing a delicate equation: the spread between interest income earned from assets, notably loans and investments, and the interest expenses paid on liabilities, particularly deposits and borrowings. It is within this dynamic space that institutions must adeptly navigate the competing forces of rising deposit betas and the challenge posed by declining yields on loans.
From the large national institutions to small community banks spanning across our district, members are grappling with a common challenge: declining NIM. As illustrated in the graphs below, NIM across banks of all asset sizes and regions within our District are on the decline.
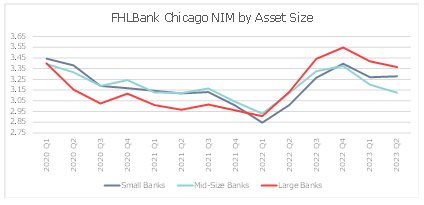
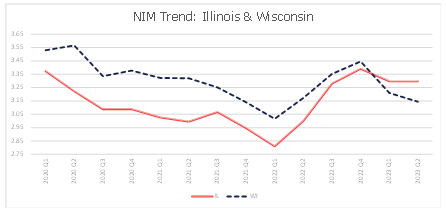
Source: S&P Global: Net Interest Margin for FHLBank Chicago member banks
Next, we will explore strategies banks can employ to maintain profitability amidst this evolving environment. While NIM erosion is a common thread, the nuances of approach, adaptation, and innovation in response to these challenges can significantly impact a bank’s success.
The Deposit Dilemma: Strategies Amidst Shifting Market Rates
In light of the current uncertain interest rate environment, banks and credit unions face the challenge of staying competitive without solely relying on deposit rate increases. One strategic avenue for members is to harness the power of social media in advertising campaigns. By leveraging platforms like Facebook, X (formerly Twitter), and Instagram, depository institutions can remind their customers and potential clients that they remain a viable, reliable option and irrespective of the interest rate fluctuations. In an era where ethical depositors seek ways to align their financial choices with their values, banks can gain a competitive edge by highlighting their commitment to environmental and societal justice as well as community investment and outreach. Initiatives such as becoming a "B Corporation" can not only help institutions become greener and more socially responsible but also resonate strongly with customers who prioritize these values. Additionally, joining global alliances like the Global Alliance for Banking on Values can further cement their commitment to the greater good and ethical banking practices.
In our data-driven age, both banks and credit unions should make use of data analytics to monitor the market and understand both their competitors' moves as well as the demographics of their current customer base. By carefully segmenting accounts based on customer demographics, behavior, and preferences, member institutions can identify opportunities to deepen their outreach and maintain or expand their deposit base.
Another effective strategy is to reach out to small businesses. By offering new specialized business accounts with added features, competitive pricing, and rewards programs, institutions can expand to business related deposits - which tend to be stickier. Members could also couple this approach with leveraging FHLBank Chicago small business advances, which offers zero-percent borrowing to members as a mechanism to support qualified small-business lending. This creates a dual pronged approach to expand small business deposits within the communities you serve.
These initiatives not only attract new business deposits but also promote customer loyalty and make these deposits stickier in the long run. In a dynamic interest rate landscape, a multifaceted approach that combines strategic messaging, ethical alignment, data-driven insights, and tailored offerings can help banks and credit unions to thrive regardless of the direction interest rates take
Marginal Cost Matters: Unlocking Profitability
FHLBank Chicago’s core mission is to provide members with a reliable source of funding for housing finance, community lending, and asset liability management. Our goal is to ensure members can meet the needs of their communities in all economic cycles. Leveraging FHLBank Advances strategically can lower your funding costs and limit the squeeze on profitability amid our unique interest rate environment.
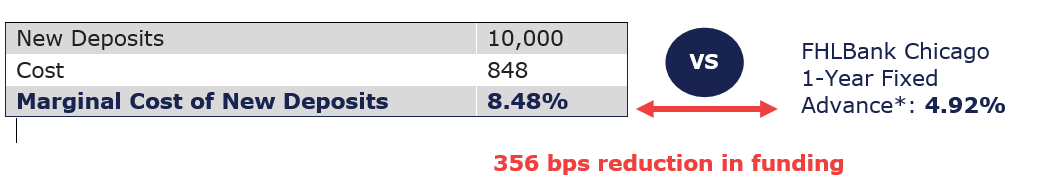
Let's consider a simplified scenario to understand how the strategic choice of leveraging FHLBank advances can effectively reduce the overall cost of funds as compared to the option of raising deposit rates.
Currently, a $10K 1-year certificate of deposit in the greater Madison, Wisconsin region top range is 3.50%. If you are an institution considering a 1-year certificate of deposit (CD) special to attract new deposits at 3.00%, consider the example below:
| Before Promotion | Amount | Rate | Cost |
|---|---|---|---|
Savings | 100,000 | 0.26% | 260 |
1-Year CD | - | 3.00% | - |
Total | 100,000 | 0.26% | 260 |
After Promotion | Amount | Rate | Cost |
|---|---|---|---|
Savings | 80,000 | 0.26% | 208 |
1-Year CD Special ($10K new, $20K cannibalized) | 30,000 | 3.00% | 900 |
Total | 110,000 | 1.01% | 1,108 |
*Rate
includes a 5 bp discount per current long-term advance specials, and Class B1
stock dividend as a reduction to the regular advance rate, based on a projected
B1 dividend rate of 8.00% for Q2 2023 payable in Q3 2023, an opportunity cost
of buying stock (estimated to be 4.987%, the average Effective Federal Funds
Rate during Q2 2023), and 4.50% advance capitalization for illustration
purposes only. All rates are indicative only as of 8/25/2023.
While the CD promotion would appease depositors in the short term, it could significantly elevate an institution’s cost of funds and ultimately reducing NIM. This approach could also potentially limit flexibility in offering competitive rates in within other product offerings simply due to the squeeze on funding costs, and the need to take a strategic approach on which products to price more competitively. Conversely, leveraging FHLBank advances can offer secured funding and lower marginal costs, resulting in higher NIM. This approach allows institutions to maintain competitive rates across their product spectrum, all while mitigating the risk of deposit outflows in an environment where interest rates remain unchanged.
Ultimately, the strategic choice between these two paths underscores the delicate balance banks must navigate to achieve sustainable growth, profitability, and depositor satisfaction. Striking the right balance between these options necessitates a nuanced understanding of the interest rate environment, market dynamics, customer behavior, and your institution’s unique financial position, all of which are pivotal factors in the decision-making process.
Navigating the Banking Tightrope
Striking the right balance between meeting customer demand and maintaining healthy NIM is a delicate balancing act in asset liability management. While raising rates to meet the competition is appealing to depositors, the consequential increase in funding costs can prove to be a double-edged sword. As depository institutions continue to grapple with the current complexities of our economic environment and rate uncertainty, there are a vast array of strategies that can be deployed from leveraging FHLBank advances to reduce funding costs to deploying clever marketing and analytics strategy to maintain and expand your customer base. Whatever strategy you choose, the Federal Home Loan Bank of Chicago is here to support and guide you as a trusted advisor.
To Learn More
Contact your Sales Director to learn more about your marginal cost of funds and how leveraging FHLBank Chicago advances can provide an alternative solution to raising deposit rates.
Looking for a printable version of this white paper? Download the PDF.
Contributors
 | Cathy Kiriakos AVP, Senior Analyst Sales, Strategy, and Solutions |
Disclaimer
The scenarios in this paper were prepared without any consideration of your institution’s balance sheet composition, hedging strategies, or financial assumptions and plans, any of which may affect the relevance of these scenarios
to your own analysis. The Federal Home Loan Bank of Chicago (FHLBank Chicago) makes no representations or warranties (express or implied) about the accuracy, currency, completeness, or suitability of any information in this
paper. This paper is not intended to constitute legal, accounting, investment, or financial advice or the rendering of legal, accounting, consulting, or other professional services of any kind. You should consult with your
accountants, counsels, financial representatives, consultants, and/or other advisors regarding the extent these scenarios may be useful to you and with respect to any legal, tax, business, and/or financial matters or questions.
In addition, certain information included here speaks only as of the particular date or dates included, and the information may have become out of date. The FHLBank Chicago does not undertake an obligation, and disclaims any
duty, to update any of the information in this paper. Moreover, this paper may include forward-looking statements, which are based upon the FHLBank Chicago’s current expectations and speak only as of the date(s) thereof.
These forward-looking statements involve risks and uncertainties including, but not limited to, the risk factors set forth in the FHLBank Chicago’s periodic filings with the Securities and Exchange Commission, which are
available on its website.